Dynamic range, and where your data stops being data
Bandwidth claims mean nothing without a dynamic range to go with them. How to measure the noise floor honestly, why averaging buys less than you expect, and how to read a spectrum that has run out.
THz-TDS transmission calculator
Everything described here, worked out in your browser. Nothing is uploaded.
Bandwidth without dynamic range is not a specification
"Bandwidth to 6 THz" is not a claim about a spectrometer until you also say how far above the noise the signal is at 6 THz. Every terahertz spectrum decays into its own noise floor at some frequency, and the frequency at which that happens depends on how long you averaged. Average four times as long and the floor drops by 6 dB, so the quoted bandwidth creeps upward — without the instrument having changed at all.
The honest figure is a pair: the peak dynamic range, and the frequency at which the spectrum reaches some stated margin above the floor. Ten decibels is a reasonable margin. Below it, a transmission ratio is noise divided by noise.
Measuring the floor
The cleanest estimate of the noise floor comes from the quiet stretch of the time trace before the pulse arrives. Transform that segment alone and you have the noise spectrum of the same measurement, recorded under the same conditions, with no signal in it. It costs nothing, because you already recorded it.
A caution worth knowing: a synthetic or simulated trace has an exactly quiet lead-in, and dividing by it produces an absurd dynamic range — a few thousand decibels. Any number past about 120 dB is telling you the data is not a measurement.
Why averaging buys less than you hope
Uncorrelated noise falls as the square root of the number of averages, so dynamic range improves by 10 dB for every hundredfold increase in measurement time. Going from 100 to 10 000 averages costs you a hundred times the time and buys 20 dB, which at a typical spectral roll-off might move your usable edge by a few hundred gigahertz.
That is only true while the noise stays uncorrelated. Laser drift, temperature, and humidity changing over a long scan are not random between averages, and past some averaging time they dominate. The practical test is simple: average twice as long and see whether the floor actually drops by 1.5 dB. If it does not, you have hit systematic noise and more time will not help — but better temperature control or a shorter scan might.
Reading a spectrum that has run out
A transmission curve above the dynamic range limit can look entirely plausible. It will be smooth, it will have features, and the features will be repeatable if you reprocess the same file. They are not repeatable if you take the measurement again, which is the test that matters. Anything you would publish should be inside the range where a second independent measurement reproduces it.
Products mentioned
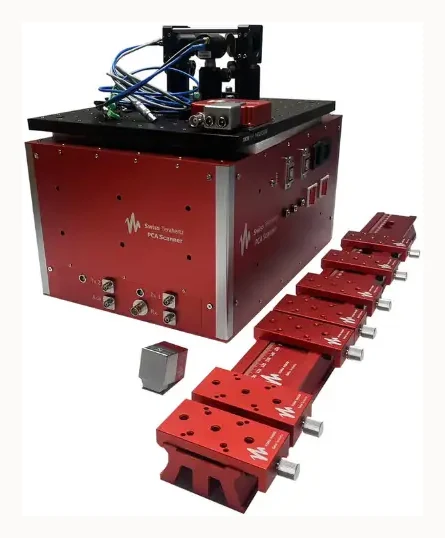
PCA Scanner